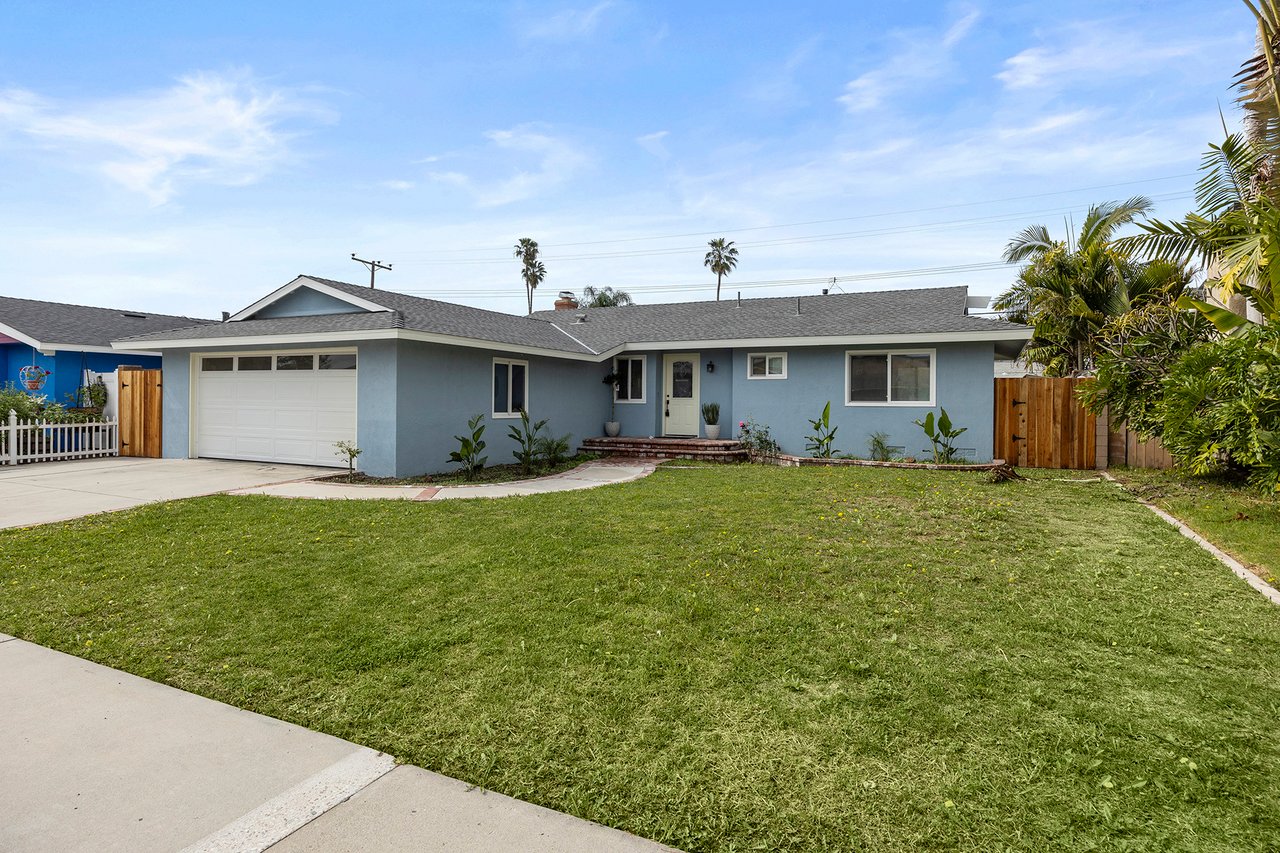
You have probably noticed it: two similar Yorba Linda homes, a few streets apart, can carry very different price tags. In many cases, the line you cannot see on the listing — the school attendance boundary — is doing some of the heavy lifting. If you are buying, selling, or investing, understanding how local schools tie into value helps you set the right expectations and make sharper decisions. In this guide, you will learn what the research says, how the Placentia–Yorba Linda Unified School District (PYLUSD) landscape works, and what recent neighborhood snapshots suggest about pricing. Let’s dive in.
Why schools affect home prices
Academic studies have found a measurable, conservative link between school performance and home values. In boundary-based analyses that compare similar homes on either side of an attendance line, researchers typically estimate about a 1 to 4 percent home value increase for a one standard deviation improvement in test scores. For a plain‑English grounding of these methods and findings, see the literature review by Nguyen‑Hoang and Yinger at ScienceDirect. More recent boundary fixed‑effects work in the Economics of Education Review reinforces this general pattern of capitalization into prices (study overview).
Industry roundups often show larger differences when they compare homes near highly rated elementary campuses to broader county medians. One national analysis in 2024 reported a sizable premium for homes near top‑rated elementary schools. Treat this as a directional signal about buyer behavior, not a Yorba Linda‑specific number.
What drives this in practice? Many buyers rank school district quality as an important location factor. The National Association of Realtors’ 2025 Generational Trends Report shows school quality is a meaningful consideration across age groups, especially among buyers in their prime household‑forming years (NAR report). Yorba Linda’s local profile also plays a role. The city features high owner‑occupancy and above‑average household incomes, with a substantial share of households with children (U.S. Census QuickFacts). That combination tends to amplify the school premium.
Yorba Linda’s school landscape at a glance
Yorba Linda is served mainly by PYLUSD, which publishes the official attendance boundaries used for school assignments. If you are evaluating a specific address, verify the assignment using the district’s boundary map and confirm with the district when in doubt.
Recent recognition matters to many buyers who follow school news. In 2023, four Yorba Linda elementary campuses — Brookhaven, Bryant Ranch, Lakeview, and Linda Vista — were named California Distinguished Schools, according to a PYLUSD announcement. Yorba Linda High School also appears with top local ratings on public rating sites that many buyers reference; you can review its profile on GreatSchools. Keep in mind that rating methods differ by platform and often blend test proficiency, student progress, and college readiness measures.
Market snapshot and neighborhood examples
Citywide context helps you frame expectations. Recent snapshots from market dashboards place Yorba Linda’s typical home value in the roughly $1.2 million to $1.4 million range (Zillow city index, retrieved March 2026). Within the city, neighborhood medians vary based on lot sizes, views, remodel levels, and, yes, school zones.
Here are three neighborhoods buyers often compare because of their school assignments and price bands. These ranges reflect recent neighborhood pages and solds snapshots (Redfin neighborhood dashboards, retrieved March 2026). Always treat neighborhood medians as directional since monthly samples can be small:
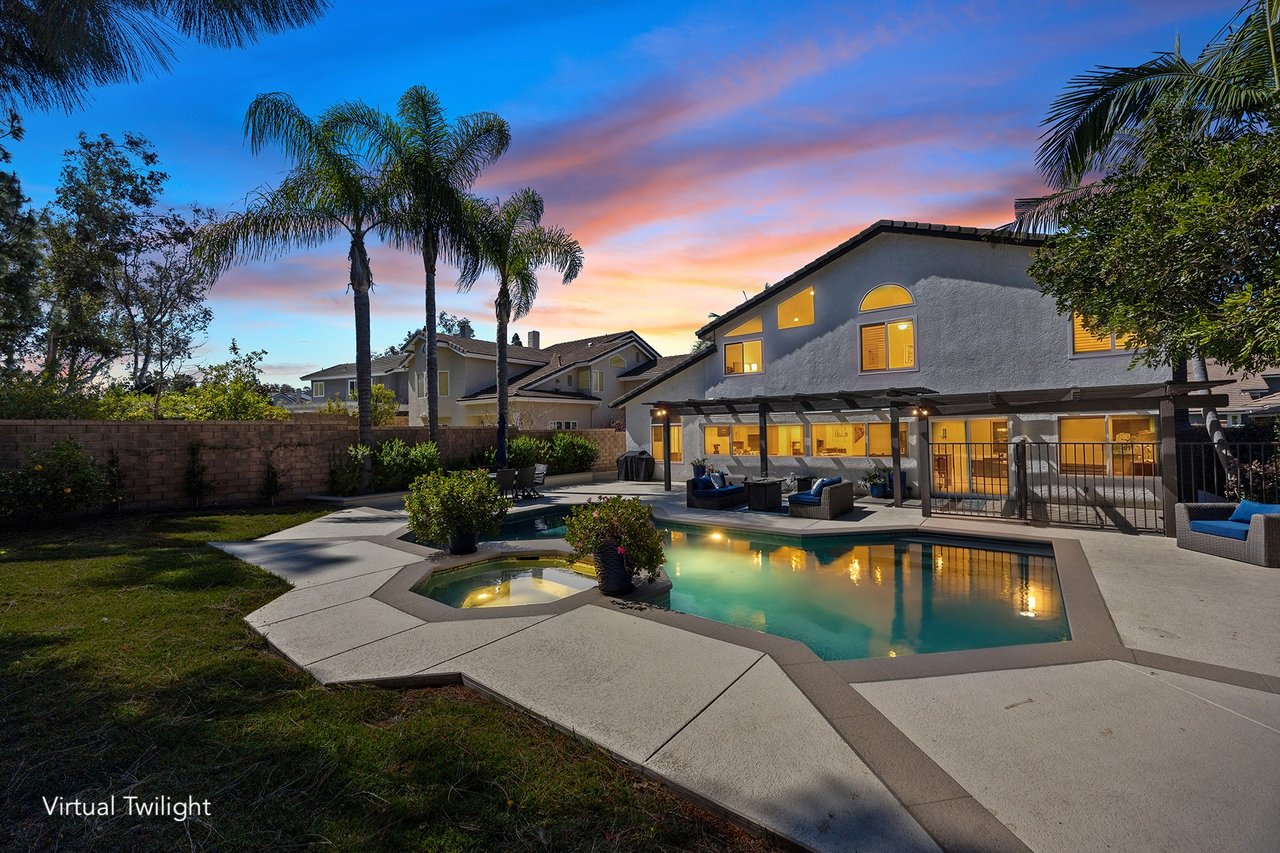
- East Lake Village. A master‑planned community that feeds strong elementary options. Recent medians have hovered around $1.7 to $1.8 million, with median days on market in the 40 to 60 day range in recent months.
- Bryant Ranch. Neighborhood that shares a name with one of the 2023 California Distinguished Schools. Monthly medians have varied widely with sample size, often between $1.1 and $1.5 million.
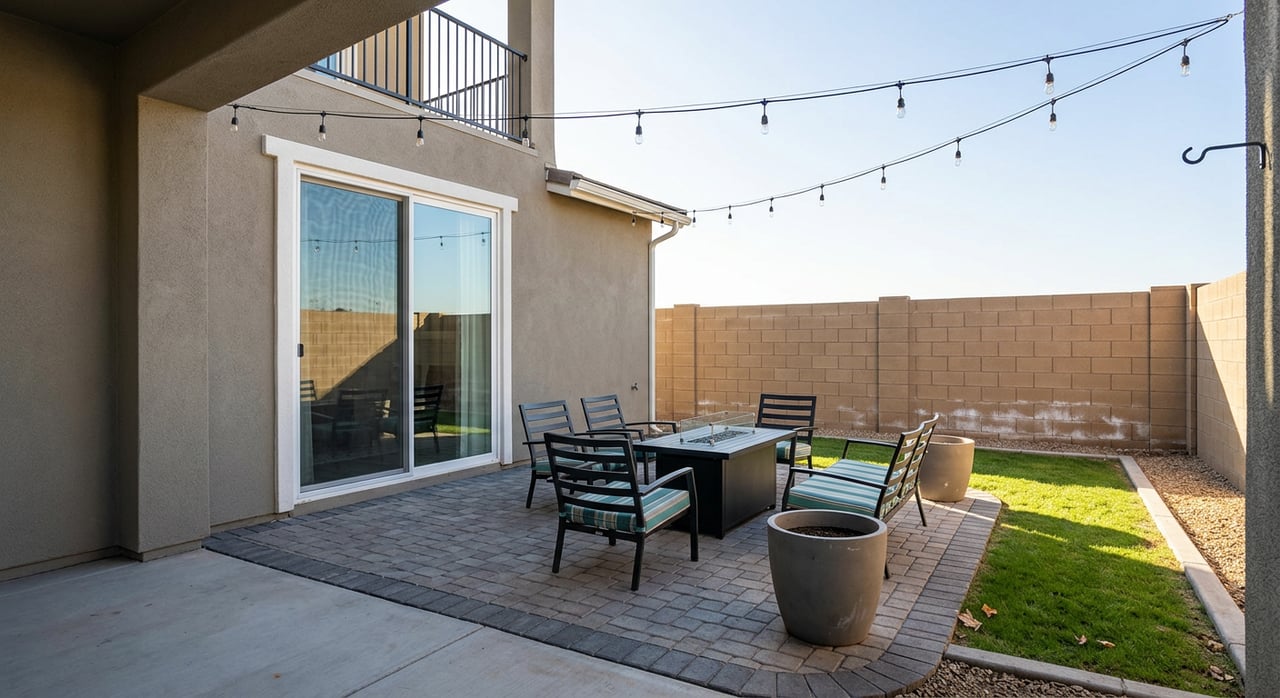
- Travis Ranch. A K–8 zone feeding Yorba Linda High School, with a broad mix of home types. Recent medians commonly land in the mid‑$1 million range.
What do these differences mean? They suggest a school‑linked price structure layered on top of housing basics like square footage, condition, and views. To see whether the “school effect” is structural, look beyond a single month and review the last 12 months, plus 3‑ and 5‑year context where possible.
How to measure the school premium in your search
If you are comparing two Yorba Linda homes and want to separate school effects from everything else, use this simple, evidence‑based workflow:
Verify the boundary. Pull the official PYLUSD attendance area for the campus you care about using the district’s boundary map. Save a date‑stamped screenshot.
Collect solds inside the boundary. Over the last 12 months, identify closed sales for homes inside that line. If you have MLS access, export addresses, sale dates, prices, square footage, beds/baths, lot size, days on market, and sale‑to‑list ratios. If you do not have MLS access, use neighborhood sold snapshots as a proxy and note the limits.
Compute the core stats. For each boundary, calculate median sale price, median price per square foot, median days on market, and the count of closed sales (n). Include the counts. If only a handful of homes sold in the period, be cautious.
Compare across a boundary. For a cleaner read on school effects, set up a side‑by‑side comparison of homes near the attendance line on each side. This mirrors the boundary‑based approach described in the academic literature (methods overview). If you cannot filter that tightly, at least present boundary‑level medians with sales counts.
Control for confounders. Features like lot size, view, pool, remodel level, HOA fees, and Mello‑Roos can shift medians more than the school zone itself. Where possible, compare similar home profiles, such as 3‑bed, 2‑bath homes built 1980–2005.
Date your data. Write “as of March 2026, last 12 months” in your notes. Markets move. Your future self will thank you.
Seller takeaways: pricing and marketing
If you are selling in a high‑demand school zone, your strategy can harness that demand:
- Price with purpose. Use the last 12 months of school‑zone or neighborhood comps and show the sample size. When demand is deep, a sharp list price can attract multiple offers and lift your net.
- Market the assignment accurately. Use the official PYLUSD boundary and, if needed, link or reference the map so buyers can verify. Avoid claiming a school assignment without confirmation.
- Timing still matters. Listings that go live before and during peak moving months often benefit from broader buyer traffic. Combine timing with professional preparation to make the most of your week one exposure.
- Presentation wins. Staging, light repairs, and high‑quality media help your home stand out within a competitive school zone, where buyers compare similar addresses closely.
As a seller‑first team, we tailor pricing, prep, and media to engage school‑conscious buyers quickly and convert interest into offers. If you want a fast, structured sale focused on result metrics like days on market, number of offers, and net proceeds, our proprietary Two Week Selling System™ was built for you.
Buyer playbook: get value and clarity
- Be boundary‑smart. Confirm the school assignment using the district’s map. If an address sits near a line, call the district to verify.
- Compare medians and $/sq. ft. Use 12‑month medians and price per square foot by neighborhood or school boundary. Add the sales count so you can judge volatility.
- Look for close substitutes. If one zone consistently commands top pricing, consider nearby alternatives that feed your target high school. For example, Travis Ranch often posts mid‑$1 million medians while still feeding Yorba Linda High School, based on recent neighborhood snapshots (retrieved March 2026).
- Budget for features that move value. Views, larger lots, pools, and remodels can add as much or more than the school zone itself.
Common pitfalls to avoid
- Relying on monthly medians without counts. Small samples can swing results. Always note the number of sales.
- Assuming “top‑rated” means the same across sites. Rating systems differ. Read the methodology on any platform you reference.
- Skipping verification on boundary claims. School assignments are set by the district, not by listing remarks. Use the district’s map and confirm if needed.
- Overlooking fees. HOAs and Mello‑Roos can change your monthly cost, which affects overall affordability even in a favored zone.
The bottom line for Yorba Linda
Schools are one part of Yorba Linda’s pricing story, and the data suggests they matter. Academic research points to a conservative, measurable effect, while local neighborhood snapshots show real‑world price differences buyers notice at the offer table. Combine school context with careful comps, strong presentation, and a clear plan, and you are set up to make smarter choices — whether you are buying or selling.
Ready to position your home to capture school‑driven demand and sell fast at a strong net? Connect with The Bald Brothers Team to get your free Two Week Selling System™ plan.
FAQs
How do Yorba Linda schools influence home prices citywide?
- Academic reviews find a conservative 1 to 4 percent value increase for a one standard deviation rise in test scores, and local neighborhood medians often show larger real‑world gaps; both forces shape Yorba Linda pricing.
Which Yorba Linda elementary schools received recent recognition?
- In 2023, Brookhaven, Bryant Ranch, Lakeview, and Linda Vista were named California Distinguished Schools, according to PYLUSD.
How can I verify a Yorba Linda home’s school assignment?
- Use PYLUSD’s official attendance boundary map and confirm with the district; do not rely only on listing remarks.
Is Yorba Linda High School considered high‑performing?
- Yorba Linda High School appears with top local ratings on public sites used by buyers; you can review its profile on GreatSchools, noting that methods vary by platform.
How big is the school effect in dollars for Yorba Linda?
- Use two lenses: the academic estimate (about 1 to 4 percent per one standard deviation in test scores) and recent neighborhood medians by zone (for example, East Lake Village vs. Bryant Ranch vs. Travis Ranch, retrieved March 2026), understanding that monthly samples can be small.
Do homes near top‑rated schools sell faster?
- Industry analyses report faster sales and higher listing views near top‑rated campuses. Confirm locally by comparing days on market and the number of closed sales across Yorba Linda zones over the last 12 months.